Histogram Generator — Free Online Tool
Visualize the distribution of your numerical data with an adjustable histogram chart.
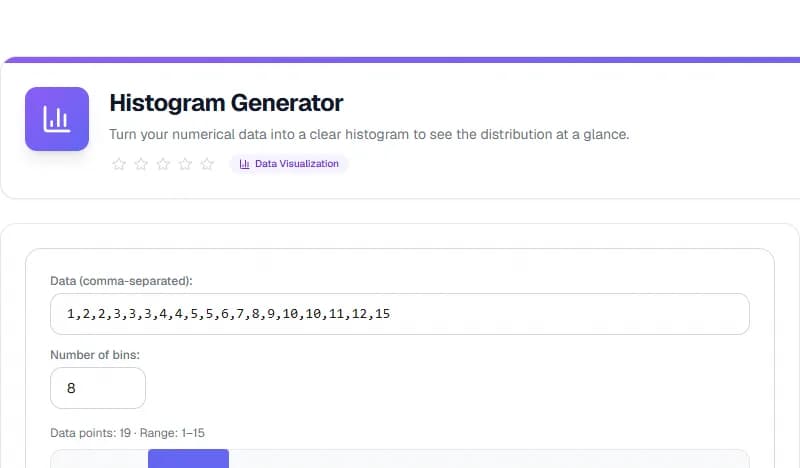
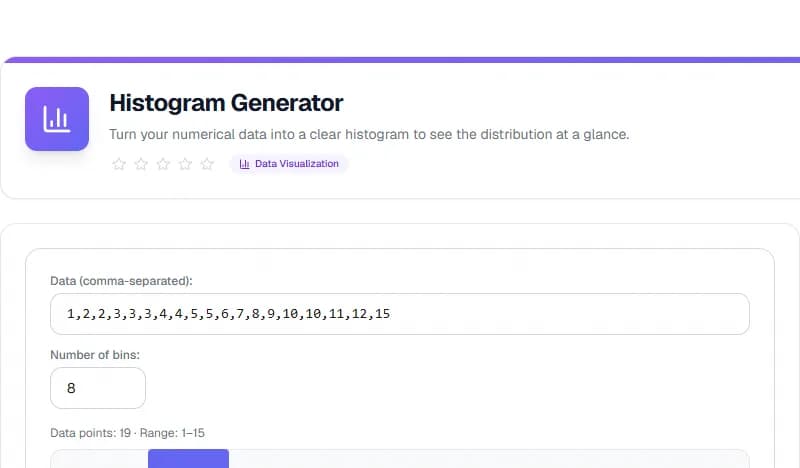
What is Histogram Generator?
Visualize the distribution of your numerical data with an adjustable histogram chart.
How to Use
Open the tool, enter your values, and view results instantly. It works entirely in your browser — no sign-up needed.
Why Use It?
Histogram Generator runs in your browser, keeping your data private on your device. Free, no limits, works on all devices.
Try the Histogram Generator now — free and private.
Step-by-Step Usage
- Open the Histogram Generator
- Enter data separated by commas
- Set the number of bins
- View the histogram instantly
Key Features
- Visual distribution chart
- Adjustable bin count
- Real-time updates
- Range and count stats
Frequently Asked Questions
How many bins should I use?
Start with 5-10 bins; adjust based on your data size.
Is it free?
Yes, free and private in your browser.
Start using the Histogram Generator tool now — it's free and works entirely in your browser.
Pro Tips
- Use 5-15 bins for readability
- Check for outliers first
- Histograms show frequency, not time
Conclusion
The Histogram Generator is a practical, free solution that handles the task quickly and accurately in your browser. Whether you are a beginner or an experienced user, it removes the guesswork and saves you time.
You can use the Histogram Generator as often as you need — there are no limits, no sign-up, and no data is ever uploaded. Simply open the tool, enter your details, and get your result in seconds.
Start using the Histogram Generator now and see how it simplifies your workflow.
Taskly Team
The Taskly team is dedicated to providing the best free online tools and educational content.
Enjoyed this article?
Subscribe to our newsletter to get the latest articles and tools as soon as they are published.
Newsletter
Get the latest tools and articles in your inbox